

Creating a Story
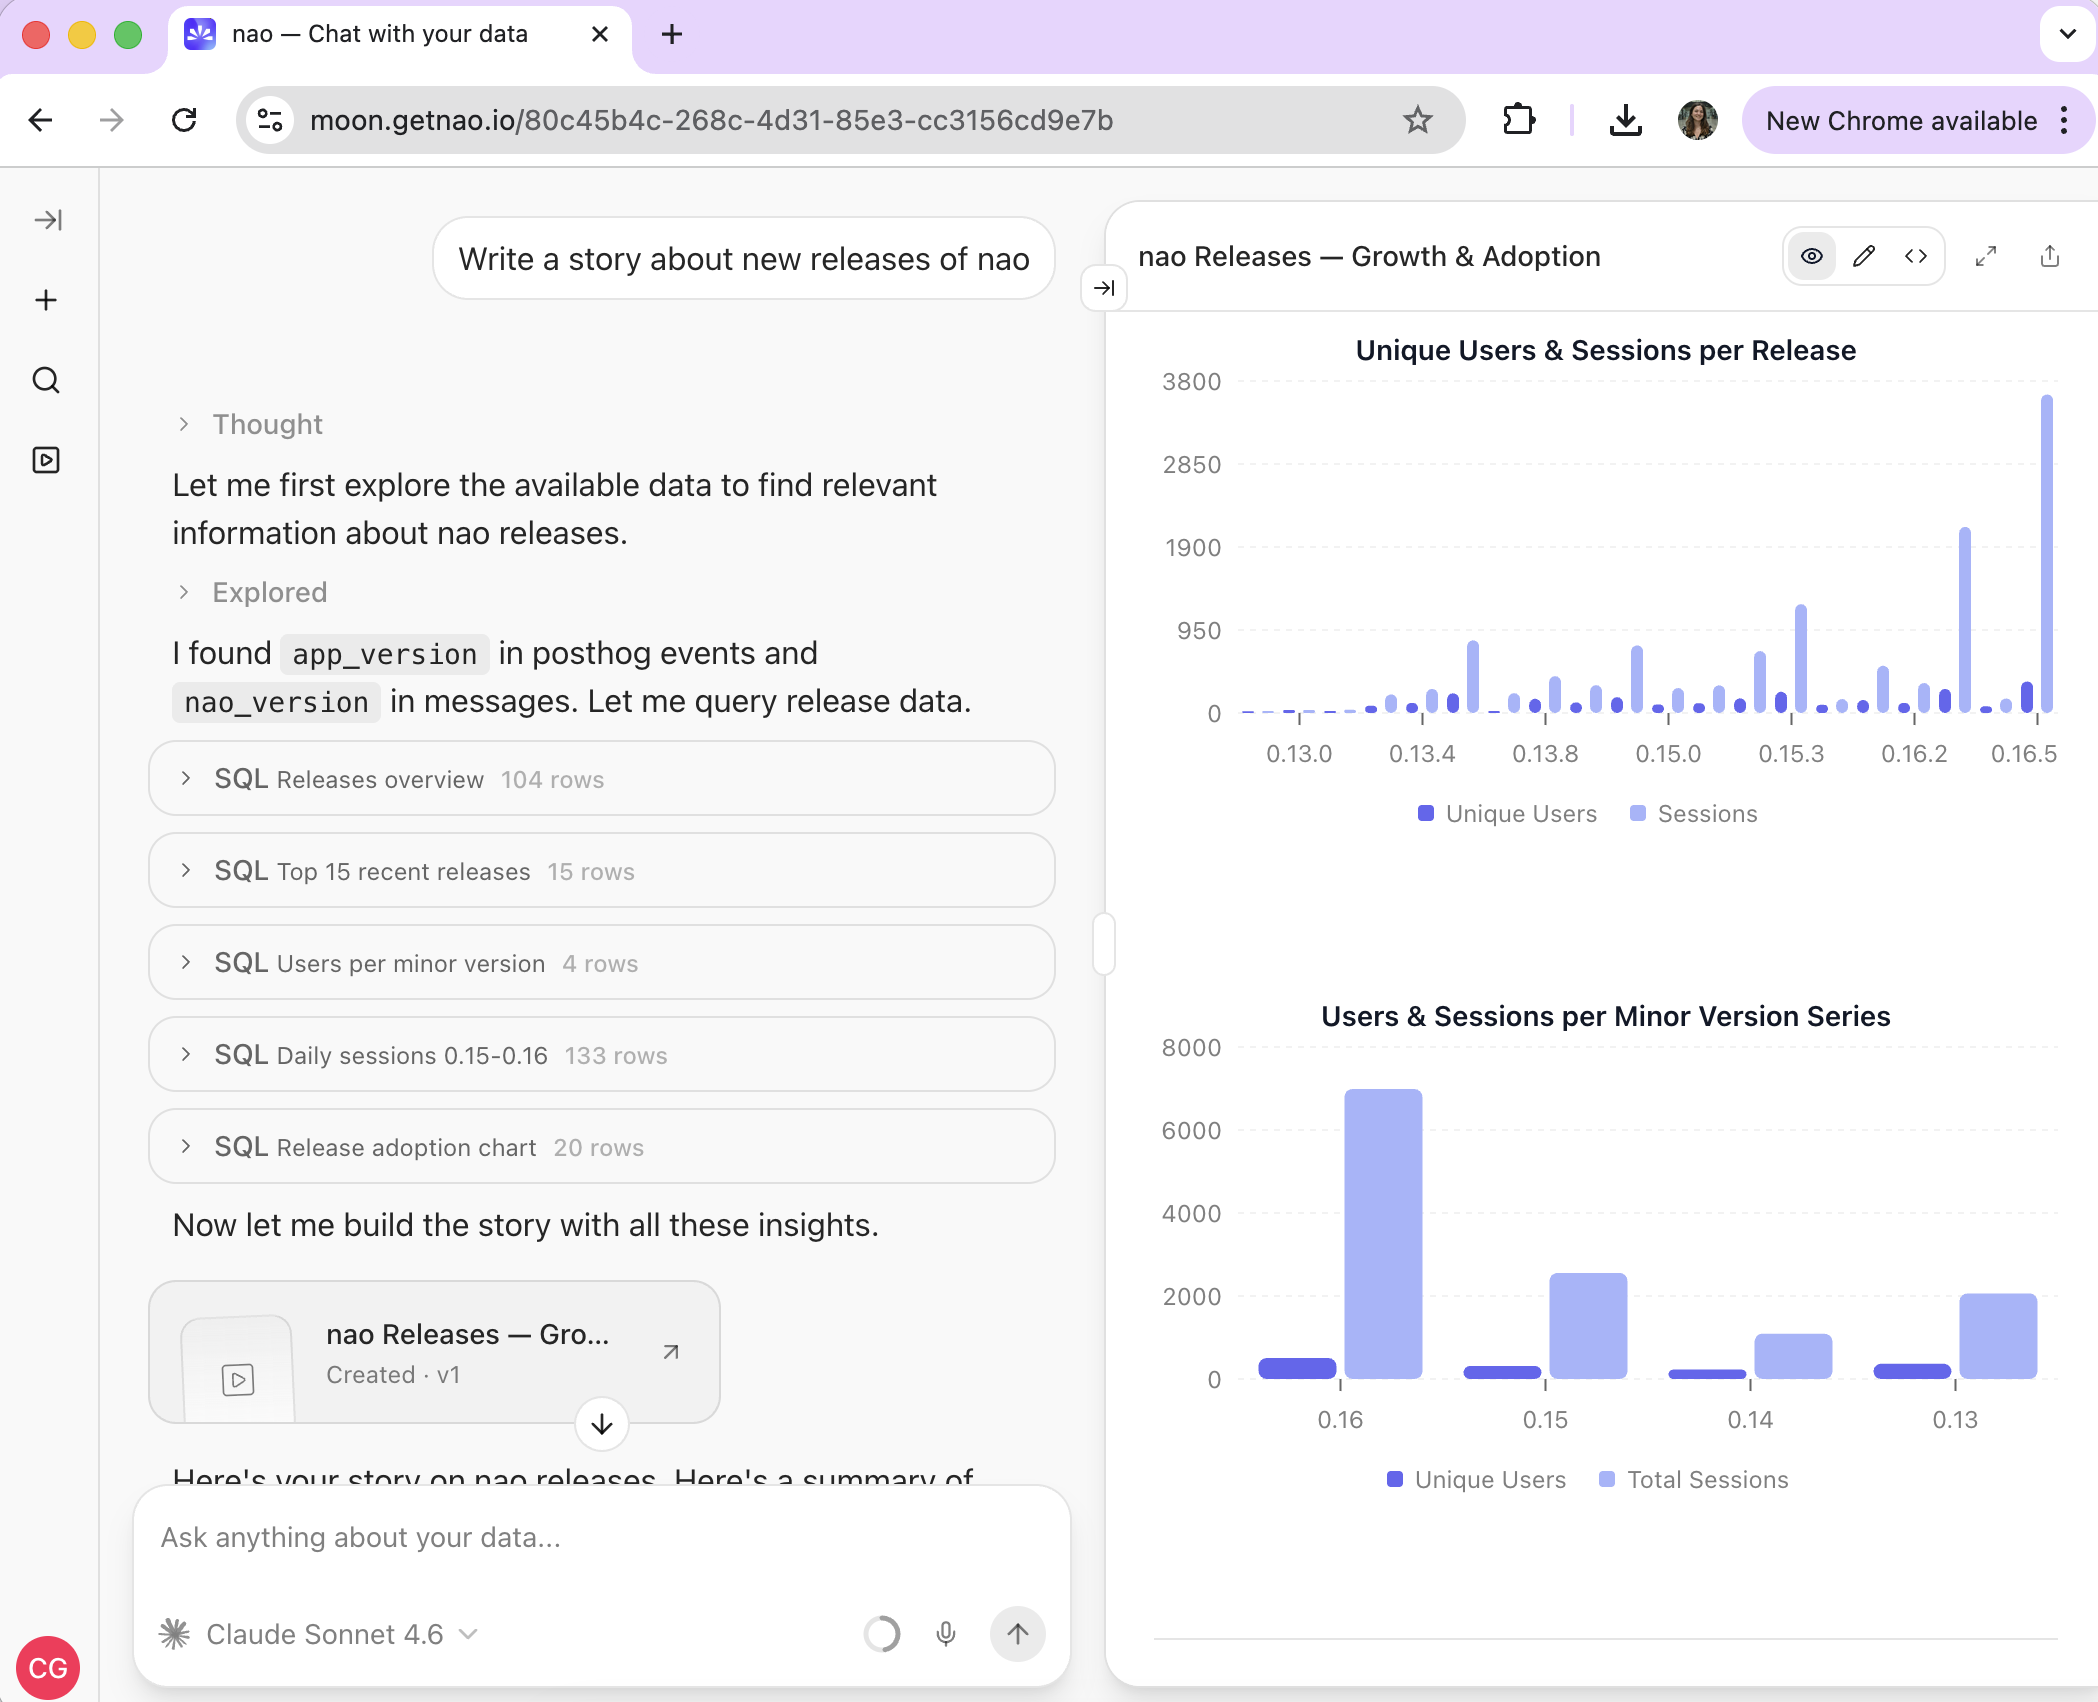
Stories are created directly from a chat conversation. Simply ask the agent to write one:“Write a story about our new user growth since the last release.” “Create a story summarizing MRR trends over the past quarter.”The agent will:
- Run the relevant queries against your data.
- Compose a structured document with narrative text, charts, and tables embedded inline.
- Open the story in a side panel next to the chat thread.
Editing a Story
Once a story is open in the side panel, click the pencil icon to switch to edit mode. The editor is Notion-style: every block (text, chart, table) can be dragged and reordered using the grip handle on the left. You can edit text in rich markdown, rearrange sections, and remove blocks you don’t need. When you’re done, click Save: this creates a new version of the story. To discard your changes, click Cancel.Renaming a story
The story owner can rename a story from its title in the header, without opening the editor. Click the title, type a new one, and the change is saved in place. The new title propagates everywhere the story is referenced - other story pages and the chat cards that link to it - and the story’s link stays the same, so shared URLs keep working.Arranging charts into a grid
Charts and tables don’t have to stack one per row. In edit mode, each chart and table has a drag handle next to its edit pencil:- Move a block by dragging its handle anywhere in the story.
- Put blocks side by side by dropping one beside another - they form a row. Drop a third into an existing row to add it.
- Resize by dragging the divider between two charts in a row. Widths snap to clean fractions (halves, thirds, quarters), and charts in a row line up at the same height with aligned baselines. Labels and legends adapt as columns get narrower.
Selecting multiple blocks
To move several blocks at once, select them first:- Cmd/Ctrl-click a block to toggle it in the selection.
- Shift-click to select a range.
- Esc, or a plain click, clears the selection.
Tabs
A story can be split into tabs so one report can hold several views without becoming a long scroll. Tabs are written with<tabs> markup:
Filters
Interactive filters are a beta feature and are off by default. Enable them on your deployment by setting
BETA_STORY_FILTERS_ENABLED=true. Until then, the filter controls and the agent’s filter tooling are hidden.Declaring a filter
A filter is declared with a<filter /> tag. Four types are available:
For
select and multi_select, give the options either from your data or as a fixed list:
table+column and your project has more than one database, add database_id so nao loads the options from the right connection.
Wiring a filter into SQL
A chart or table query opts into a filter with a{% filter <id> %} ... {% endfilter %} block, and drops the selected value in with {{ filters.<id>.sql }}:
{{ filters.<id>.sql }}expands to the selected value(s), safely quoted.- For
date_range, the single{{ filters.<id>.sql }}already expands to'start' AND 'end', so pair it withBETWEEN- don’t reach for.start,.end, or.value. - When a filter has no selection, its whole
{% filter %}block is stripped before the query runs, so the query still works with nothing selected. Changing a selection re-renders and re-executes the affected charts and tables, and the same applies on live-story refreshes.
Versions
Every time you save a story, nao creates a new version. Use the version navigator in the story header (v1 / v2 / ...) to browse previous versions.
- ← / → arrows step through versions.
- When viewing an older version, a Restore button lets you roll back to that version (creating a new version from it).
Editing Charts
After a chart is generated, you can tweak its configuration without re-running the query. In a chat thread: click the pencil icon next to the chart’s download button. This opens an edit dialog where you can change:- Chart title
- Chart type (bar, line, area, pie, etc.)
- X-axis key and type
- Per-series settings: data key, label, and color
Editing the Story Code
The story side panel has a Code view that shows the raw markdown behind the story. This view is now editable: you can modify text, chart tags, table tags, and grid blocks directly. The editor validates your changes in real-time:- Missing required chart attributes (
query_id,chart_type,x_axis_key) - Invalid chart type or axis type values
- Malformed or empty
seriesdefinitions - Missing
query_idon table blocks - Unterminated or unclosed tags
- Out-of-range
colson grid blocks
Adding a Chart from the Thread
When the agent produces a chart in the chat thread, you can embed it directly into a story:- Open the story side panel.
- Ask the agent to add the chart: “Add this chart to the story.”
Sharing a Story
Click the share icon in the story header to open sharing settings. You can share with:Entire project
All members of your nao project can view the story via the shared link.
Specific people and groups
Search by name or email to select individual team members, or pick a
user group to share with everyone in it.
- Copy link - grab the URL again.
- Update access - add or remove specific people (for specific-person shares).
- Unshare - revoke access and disable the link entirely.
Sharing, forking, and text selection
Once a chat or story is shared, recipients can branch from it or ask targeted follow-ups without breaking the original. The same selection-based “Ask” flow also works on your own (non-shared) chats and stories. Continue chat On a shared chat, Continue chat opens a new forked chat that contains the full shared history. Each click creates a fresh fork, so the original conversation is never modified. The fork copies the messages only: stories that belong to the origin chat are not duplicated into your Stories library. Discuss story On a shared story, Discuss story opens a new chat with the story embedded at the top in editable form, ready to be questioned or refined. Ask about a selection Select any text inside a chat or a story and an Ask button appears above the selection. Clicking it opens an inline frame where you can quote the selection and ask a follow-up about that specific passage:- The quoted text shows up as a pending citation in the input until you send the question, so you can see exactly what the agent will see.
- Once sent, the answer keeps a Go to original selection link that jumps back to the exact passage in the source chat or story.
- The frame leaves a small persistent indicator when collapsed so you can reopen it later.
- Your own chats
- Your own stories
- Shared chats and stories you have received
- The admin Chats replay view (asking about a past chat for debugging or follow-up)
Exporting stories
Stories can be exported to PDF or HTML from the download button in the story header. Export works on your own stories and on shared stories, and you can pick any existing version from the version navigator before exporting. PDF- A4 page size, formatted for printing.
- Charts are rendered as vector SVG so they stay sharp at any zoom level.
- Tables are included up to 10 rows per table to keep the document readable; longer tables are truncated in the PDF (the full dataset is still available in the HTML export and in the live story).
- Self-contained single file: no external assets, works offline.
- Interactive chart tooltips are preserved, so recipients can hover data points in their browser.
- Styled for print, so File -> Print in the browser produces a clean printed copy without separate theming.
Live Stories
By default, a story is a snapshot: charts and tables freeze the data that was returned when the story was created. Live stories keep the story connected to the underlying queries so the numbers refresh on a schedule (or on demand) without anyone having to rebuild the report.Enabling live mode
- Open the story in the side panel.
- Click the settings icon in the story header.
- Toggle Live mode on.
- Pick a refresh strategy (see below).
- Save.
Refresh strategies
When live mode is on, choose how freshness should work:- Manual refresh only - the story keeps its last refreshed values until someone clicks the refresh button in the header.
- No cache (always fresh) - queries re-run every time the story is opened. Best for low-volume stories where you always want live numbers; avoid on expensive queries.
- Scheduled refresh presets - every 5 minutes, hourly, daily, weekly, or monthly.
- Custom schedule - type a schedule in plain English (e.g. “every weekday at 8am”, “first Monday of the month”) and nao converts it to cron, or paste a raw cron expression directly.
Refreshing the narrative
For live stories, you can also enable Regenerate the narrative in the same settings panel. When turned on, nao rewrites the text blocks with the updated numbers while keeping the layout intact:- Section titles stay in place.
- Charts and tables stay embedded in the same positions.
- Only the prose around them is rewritten so the commentary matches the new data.
Access and refresh on shared stories
Live refresh respects the same access rules as the share itself:- For project-wide shares, any project member can trigger a manual refresh.
- For specific-people shares, only the people on the access list can refresh.
- Scheduled refreshes always run with the story owner’s permissions, so the data the recipients see is the data the owner is allowed to query.
Certified stories
Admins can certify a story to mark it as a trusted, reviewed report. Certification is a visible quality signal for everyone with access.- Certify or remove certification from the story card’s menu or the story header menu (next to Download). The action is only shown to admins; any member can see a story’s certification status.
- A certified story shows a Certified badge (an amber shield) in the top-right of its card. Hovering it shows who certified it (“Certified by ”).
- On the Stories page, an All / Certified toggle filters the list to certified stories, and certified stories sort first.
Custom stories
Beyond the classic story documents above, nao can build a custom story - a small React data app the agent writes, builds, and publishes from a chat. Custom stories render in their own viewer and can be shared read-only like any other story.Custom stories are a beta feature, off by default. Enable them on your deployment by setting
BETA_CUSTOM_STORIES_ENABLED=true. Which members can author them is then controlled per user group with the custom story creation feature grant.Custom story theme
Custom stories can follow a project-wide theme so every one of them matches your brand. Admins configure it under Settings -> Appearance -> Custom stories:- The Custom story theme card controls the colours, fonts, blocks, tables, and charts applied to every custom story, in both a light and a dark variant.
- Toggle Apply to custom stories on to use the theme, or off to fall back to the classic nao look without losing the saved theme. Saving a theme turns it on.
- You can edit each variant by hand, or generate a theme from an inspiration source - a website URL, an image, a PDF, or a brand asset ZIP - which nao uses to propose matching colours and fonts.
Stories Library
The Stories Library is your central hub for all stories. Access it by clicking Stories in the left sidebar.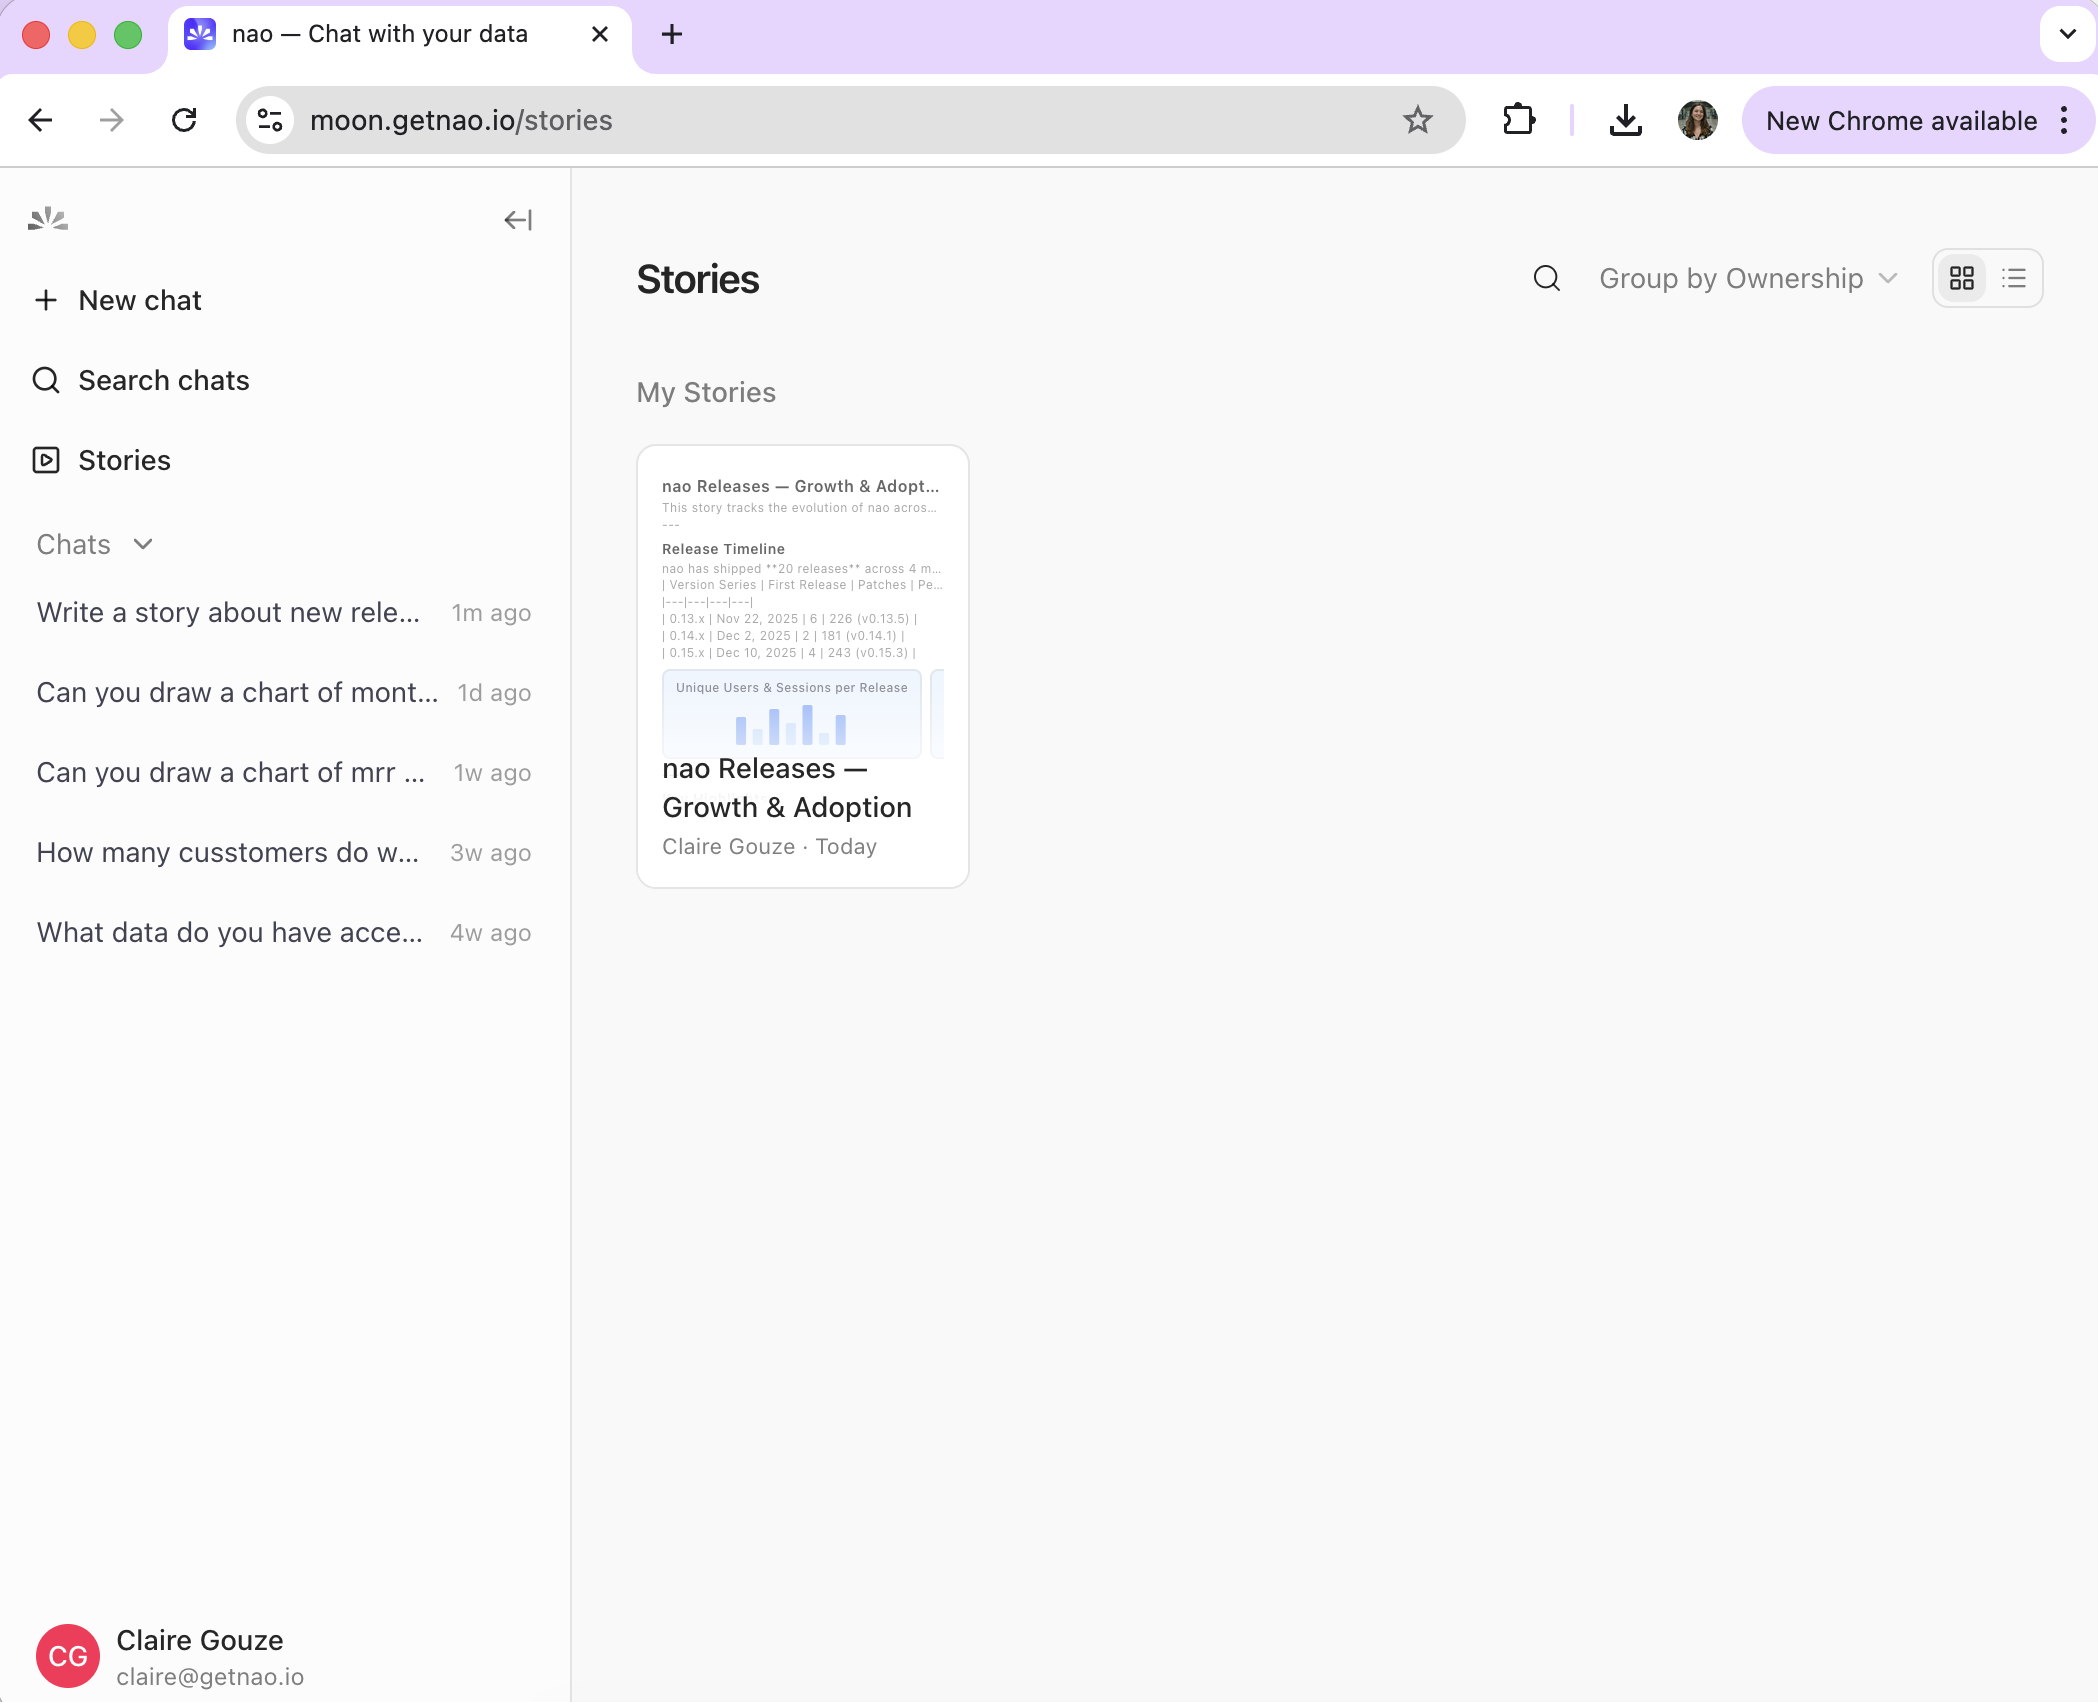
Folders
Organize stories into folders to keep the library tidy:- Create one with New folder in the explorer.
- Each folder card has a menu with Modify (rename), Move to…, Archive, and Delete. Archived folders offer Restore folder.
- Folders can be nested. Navigate down with a click and back up with the breadcrumb at the top of the explorer.
- Drag and drop stories and folders onto another folder, or onto a breadcrumb level, to move them.
Pinned and Favorites
Two sections at the top of the library promote the items you reach for most. Each one is collapsible and only appears when it has content:- Favorites - favorite any story or folder for yourself. Favorites are per-user, so only you see yours.
- Pinned - pinned stories surface at the top for everyone with access. Pinning is admin-only and applies to shared stories.