> ## Documentation Index
> Fetch the complete documentation index at: https://docs.getnao.io/llms.txt
> Use this file to discover all available pages before exploring further.
# Overview
> Interact with your analytics agent through natural language
The nao chat interface provides an intuitive way for your team to interact with data using natural language.
## Start Chat
You can access the chat interface in two ways:
### Option 1: Using nao chat command
```bash theme={null}
nao chat
```
This will start a local server at `http://localhost:5005`.
### Option 2: Using Docker
Run the Docker container to access the UI:
**With built-in example:**
```bash theme={null}
docker run -d \
--name nao \
-p 5005:5005 \
-e BETTER_AUTH_URL=http://localhost:5005 \
getnao/nao:latest
```
**With your project:**
```bash theme={null}
docker run -d \
--name nao \
-p 5005:5005 \
-e BETTER_AUTH_URL=http://localhost:5005 \
-v /path/to/your/project:/app/project \
-e NAO_DEFAULT_PROJECT_PATH=/app/project \
getnao/nao:latest
```
Access the UI at `http://localhost:5005`.
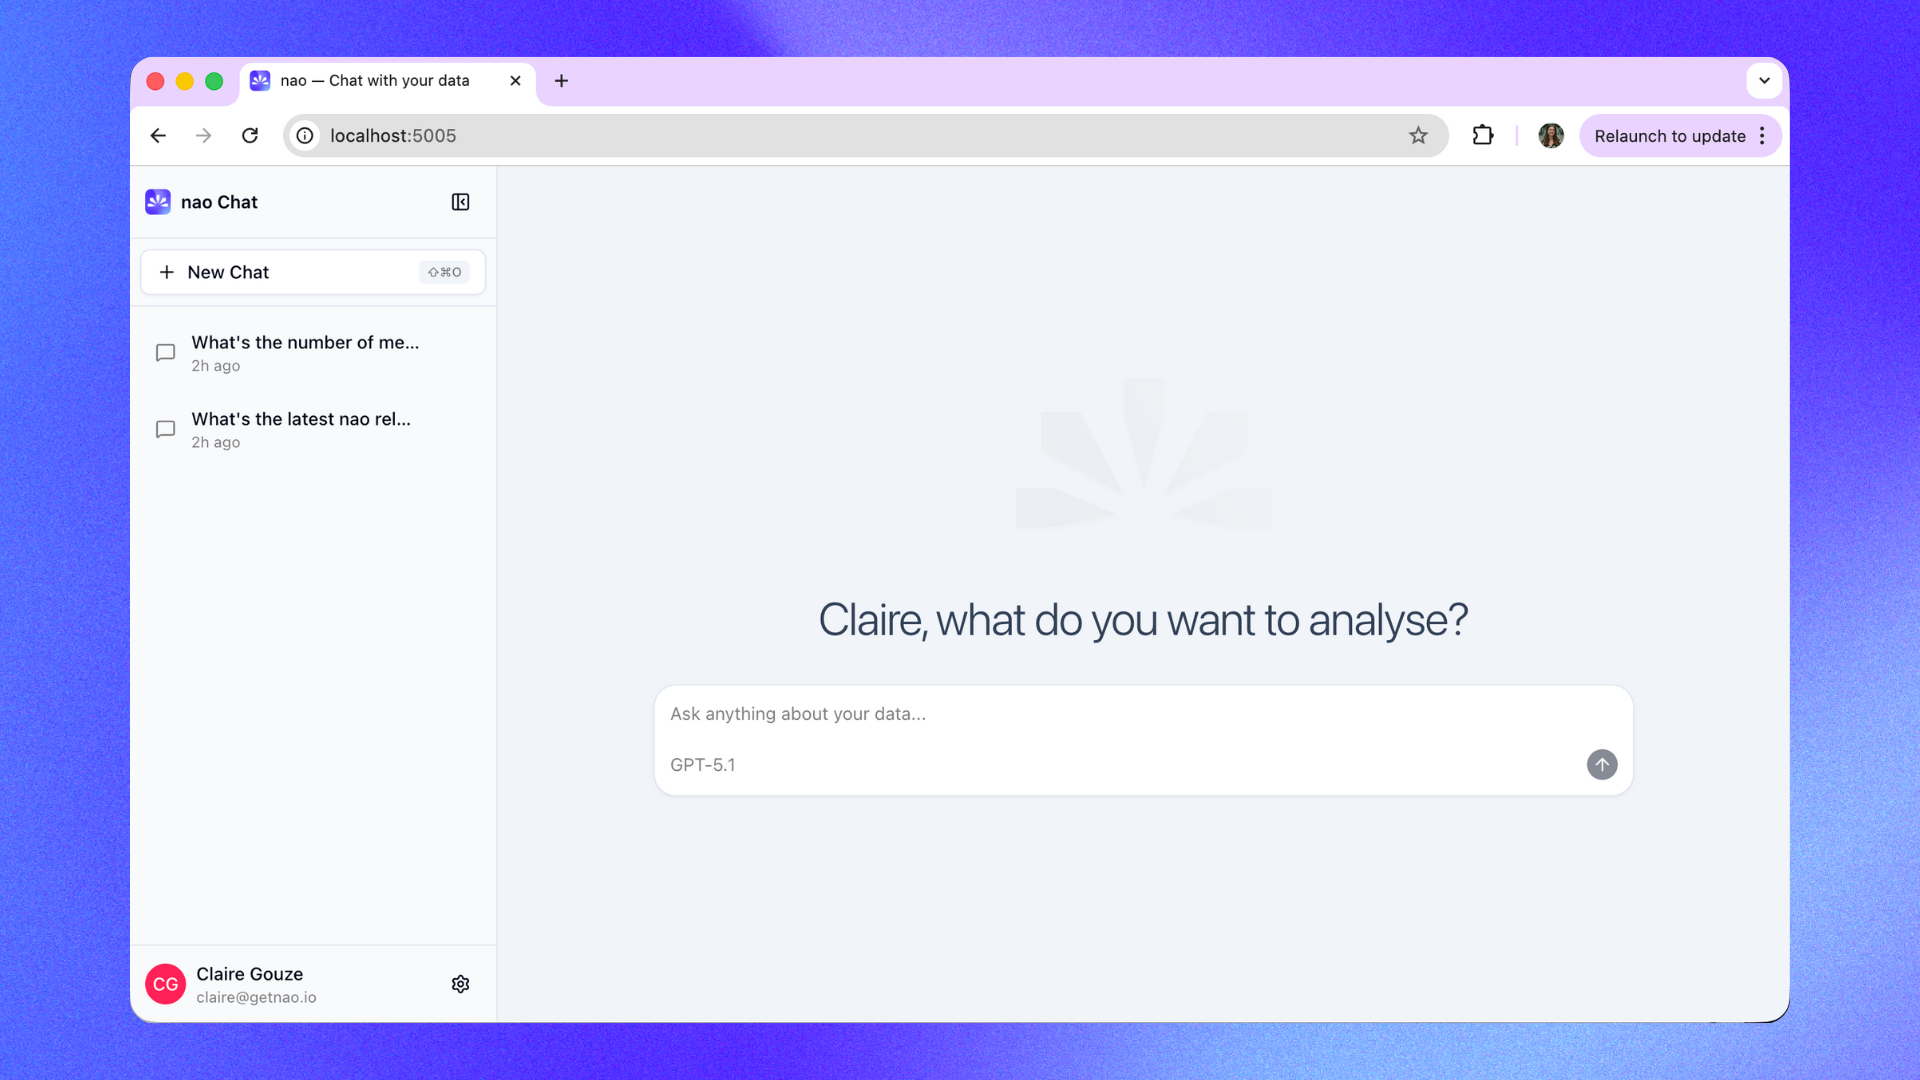 The chat interface runs locally on your machine. No data is sent to external servers unless you configure an external LLM provider.
## Ask Questions
**Question Input**
* Type your question in natural language
* Reference previous results in follow-up questions
**Response Display**
The agent's response includes:
* **Answer**: Plain language summary of findings
* **SQL Query**: The generated query (expandable)
* **Data Table**: Results in table format
* **Visualizations**: Automatic charts when appropriate
* **Sources**: Which context files were used
## Tool call density
By default the agent shows its work in detail: SQL queries, Python, and sandbox executions each render as their own block in the thread, alongside charts and stories.
If that is more than you want to read, change it from **Settings** -> **Account** -> **General Settings** -> **Tool Call Density**. The slider has two positions:
* **Detailed** (default) - SQL, Python, and sandboxed code executions are shown as individual expandable blocks.
* **Compact** - those steps are folded into a single collapsed group you can expand on demand. Charts, stories, clarifications, and follow-up suggestions stay visible either way.
The setting is per user and follows you across devices.
## Give Feedbacks
Each response has:
* 👍 Thumbs up - Mark good responses
* 👎 Thumbs down - Flag issues
These responses given by your users are stored and accessible for you to audit.
**What's Next?**
Explore all chat features and agent tools
Set up Slack integration for your team
The chat interface runs locally on your machine. No data is sent to external servers unless you configure an external LLM provider.
## Ask Questions
**Question Input**
* Type your question in natural language
* Reference previous results in follow-up questions
**Response Display**
The agent's response includes:
* **Answer**: Plain language summary of findings
* **SQL Query**: The generated query (expandable)
* **Data Table**: Results in table format
* **Visualizations**: Automatic charts when appropriate
* **Sources**: Which context files were used
## Tool call density
By default the agent shows its work in detail: SQL queries, Python, and sandbox executions each render as their own block in the thread, alongside charts and stories.
If that is more than you want to read, change it from **Settings** -> **Account** -> **General Settings** -> **Tool Call Density**. The slider has two positions:
* **Detailed** (default) - SQL, Python, and sandboxed code executions are shown as individual expandable blocks.
* **Compact** - those steps are folded into a single collapsed group you can expand on demand. Charts, stories, clarifications, and follow-up suggestions stay visible either way.
The setting is per user and follows you across devices.
## Give Feedbacks
Each response has:
* 👍 Thumbs up - Mark good responses
* 👎 Thumbs down - Flag issues
These responses given by your users are stored and accessible for you to audit.
**What's Next?**
Explore all chat features and agent tools
Set up Slack integration for your team